

Tea is a crucial export for several countries, and understanding its performance requires a deep dive into various export indicators. This post provides a detailed analysis of tea export metrics for India, Indonesia, Kenya, and Sri Lanka from 2018 to 2022. We will explore the underlying trends in export quantity, unit value, and value indices to understand how Sri Lanka’s tea export performance stands out. The data analysed is from the Food and Agriculture Organization Corporate Statistical Database (FAOSTAT).
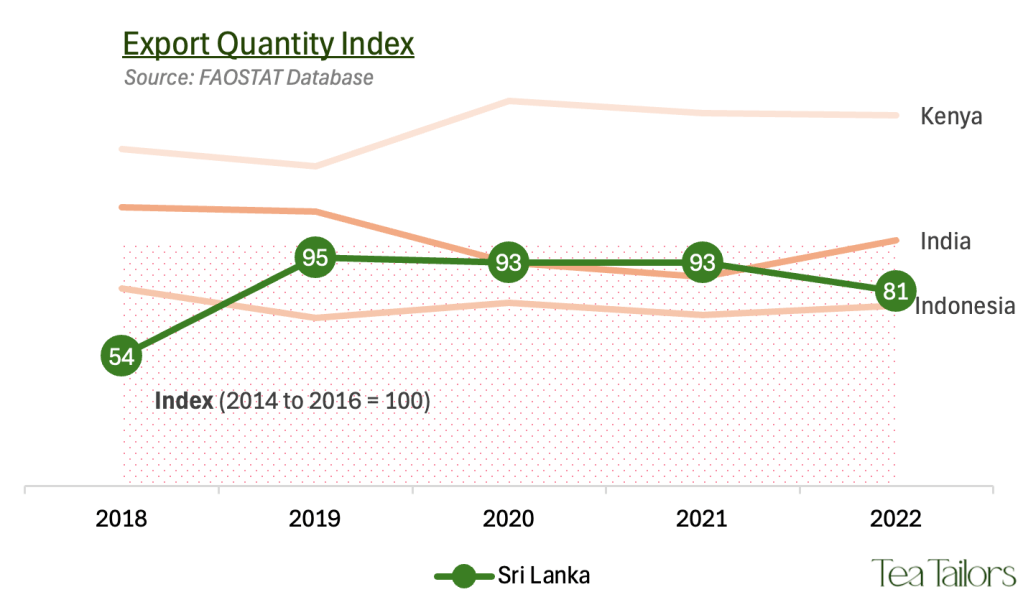
This index measures the volume of tea exports compared to the base period (2014-2016). A value of 100 is the average export volume during the base years.
Sri Lanka’s export quantity index shows significant volatility. The index fell sharply to 54 in 2018, reflecting a substantial decrease in export volumes. This decline can be attributed to several factors. These include adverse weather conditions and economic challenges, impacting tea production and export capacity. But, from 2019 to 2021, Sri Lanka’s export quantity index stabilized around the mid-90s, indicating a partial recovery. Despite this, Sri Lanka’s export quantity index remains the lowest among the countries analyzed. This suggests ongoing issues in scaling up production.
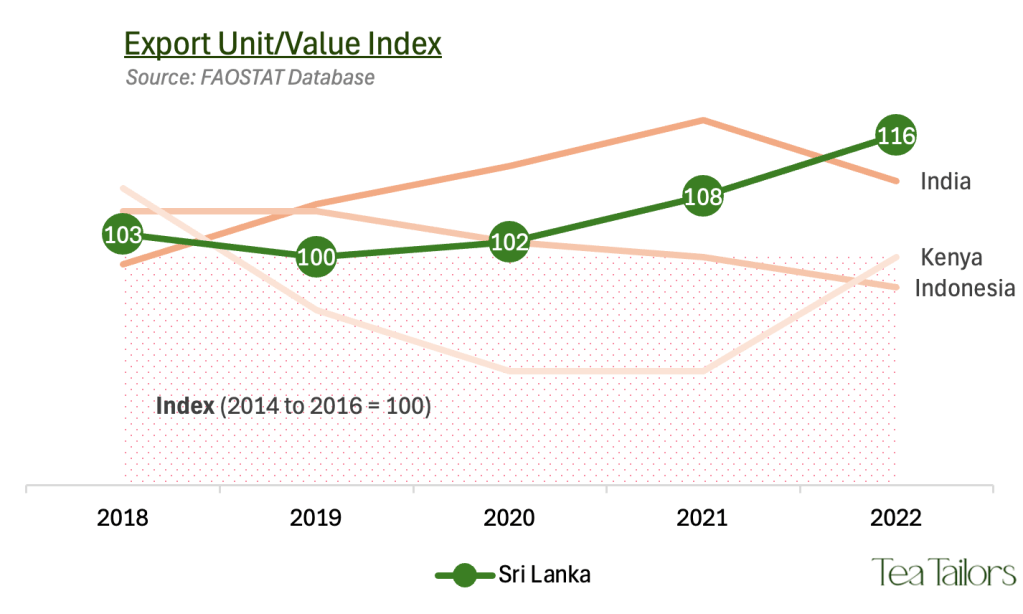
This index tracks the average price per unit of exported tea. It indicates how much revenue is generated per unit of tea exported.
In contrast to the export quantity index, Sri Lanka’s export unit/value index exhibited a consistent upward trend. Starting at 103 in 2018, it rose to 116 by 2022. This trend indicates that while Sri Lanka struggled with lower export volumes, it successfully increased the average price per unit of tea. This improvement in unit value suggests that Sri Lanka’s focus shifted towards premium tea markets. Higher prices are commanded for high-quality or specialty teas.
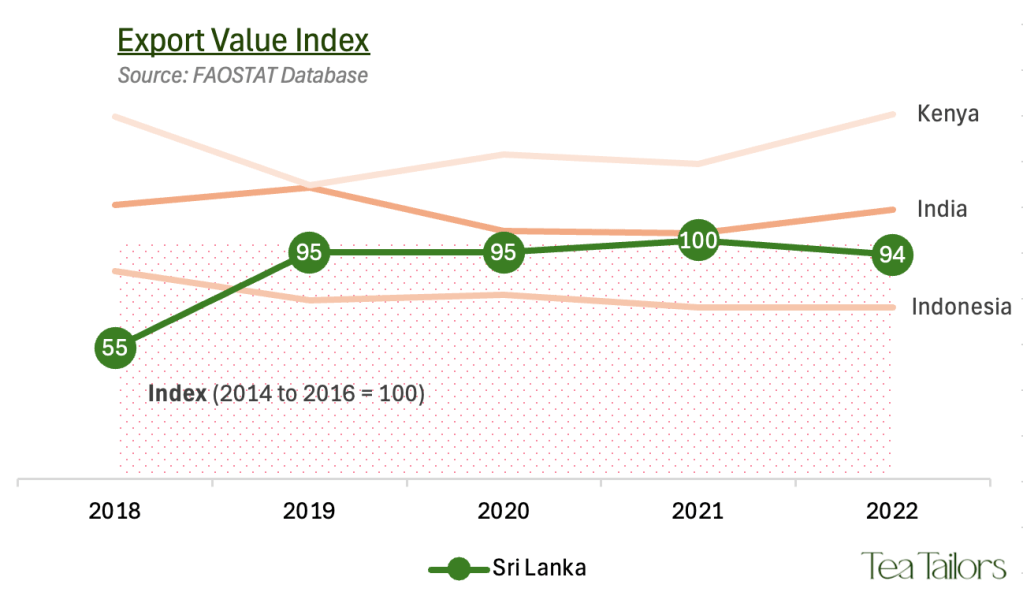
This index combines both quantity and unit value to reflect the total export revenue. It shows how overall revenue from tea exports compares to the base period.
The export value index for Sri Lanka reflects the interplay between export quantity and unit value. The index dropped to 55 in 2018, mirroring the low export quantity. But, as Sri Lanka managed to increase its unit value, the export value index improved to 100 in 2021. Although the index slightly declined to 94 in 2022, Sri Lanka’s strategy to enhance unit values helped stabilize overall export revenue.
Country Comparison
India: India shows a more stable performance compared to Sri Lanka. Its export quantity index is high and stable, peaking at 116 in 2018 before dipping slightly. India’s export unit/value index also reflects a steady increase, reaching 118 in 2021, and slightly declining to 110 in 2022. India’s consistent performance across both quantity and unit value indices results in a robust export value index. This remains above 100 throughout the period and demonstrates a strong export revenue performance.
Indonesia: Indonesia’s tea export sector exhibits poor performance across all metrics. It has a consistently low Export Quantity Index ranging between 70 and 85. This reflects challenges in maintaining and scaling production. The Export Unit/Value Index also shows a declining trend, falling from 106 in 2018 to 96 in 2022, indicating a drop in the average price per unit of tea. This decline in unit value, combined with low export quantities, leads to a reduced Export Value Index. This highlights the sector’s struggle to achieve significant revenue. The sector’s performance is influenced by economic difficulties, environmental factors like climate change, and competition from other tea-producing nations. Despite its importance to the rural economy, the tea industry in Indonesia faces persistent challenges. These include inadequate support for modernization and quality improvements, affecting its global competitiveness and revenue potential.
Kenya: Kenya’s tea export performance is characterized by its strong and stable Export Quantity Index, which remains high throughout the analyzed period. The country consistently achieves impressive export volumes, peaking at 160 in 2020. Despite this dominance in quantity, Kenya’s Export Unit/Value Index is the lowest among the countries studied, with a notable decline to 85 in both 2020 and 2021. This lower unit value suggests that Kenya’s tea is priced less per unit compared to the base period. The implication of this trend is that while Kenya has excelled in maintaining export volumes, the revenue per unit is lower, impacting overall profitability.
In-Depth Insight for Sri Lanka
Sri Lanka’s performance trends reveal a strategic shift in its export strategy. The low export quantity index suggests that the country faced challenges in increasing export volumes. It focused on enhancing the value of its tea exports. The rise in the export unit/value index reflects Sri Lanka’s efforts to target premium markets and leverage its reputation for high-quality tea.
This focus on quality over quantity has helped mitigate the impact of lower export volumes on overall revenue, as indicated by the export value index. By achieving higher prices per unit, Sri Lanka has sustained a stable export value despite fluctuations in export quantity.
Contextual Background (2014-2016 and Beyond)
During the base period of 2014-2016, Sri Lanka was recovering from decades of conflict. Its tea industry was stabilizing and rebuilding its export markets. The post-2016 period saw various challenges, including climate change impacts (droughts and heavy rains), economic fluctuations, and political instability. These factors contributed to the volatility observed in the export quantity index.
Notably, the strategic shift towards higher-value tea segments can be seen as a response to these challenges. This shift aims to maintain export revenue by capitalizing on quality rather than volume. This approach has become more pronounced in the data from 2018 to 2022.
Conclusion
Sri Lanka’s tea export performance from 2018 to 2022 reflects a complex balance between export quantity, unit value, and overall revenue. Although the country faced difficulties in maintaining export volumes, the rise in average price per unit helped stabilize export revenue. This analysis does not account for external factors, like price shocks from the COVID-19 pandemic and inflation. Such factors likely contributed to rising tea prices across the market. Even with these external influences, Sri Lanka’s ability to focus on premium markets distinguishes it from other major tea-exporting nations.
